Plot hyperparameter performance metrics
Arguments
- dat
dataframe of hyperparameters and performance metric (e.g. from
get_hp_performance()orcombine_hp_performance())- param_col
hyperparameter to be plotted. must be a column in
dat.- metric_col
performance metric. must be a column in
dat.
Examples
# plot for a single `run_ml()` call
hp_metrics <- get_hp_performance(otu_mini_bin_results_glmnet$trained_model)
hp_metrics
#> $dat
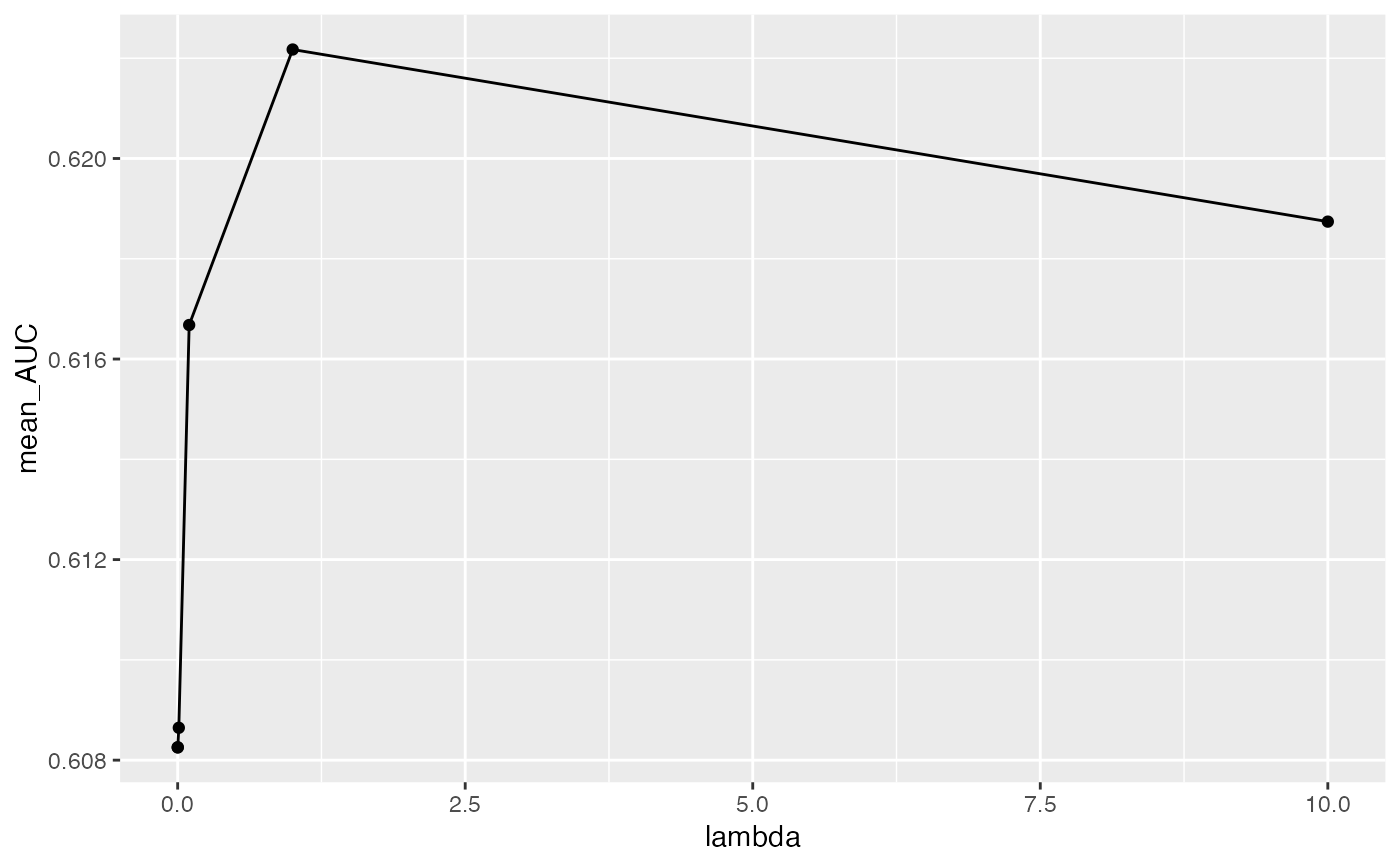
#> alpha lambda AUC
#> 1 0 1e-04 0.6082552
#> 2 0 1e-03 0.6082552
#> 3 0 1e-02 0.6086458
#> 4 0 1e-01 0.6166789
#> 5 0 1e+00 0.6221737
#> 6 0 1e+01 0.6187408
#>
#> $params
#> [1] "lambda"
#>
#> $metric
#> [1] "AUC"
#>
plot_hp_performance(hp_metrics$dat, lambda, AUC)
 if (FALSE) { # \dontrun{
# plot for multiple `run_ml()` calls
results <- lapply(seq(100, 102), function(seed) {
run_ml(otu_small, "glmnet", seed = seed)
})
models <- lapply(results, function(x) x$trained_model)
hp_metrics <- combine_hp_performance(models)
plot_hp_performance(hp_metrics$dat, lambda, AUC)
} # }
if (FALSE) { # \dontrun{
# plot for multiple `run_ml()` calls
results <- lapply(seq(100, 102), function(seed) {
run_ml(otu_small, "glmnet", seed = seed)
})
models <- lapply(results, function(x) x$trained_model)
hp_metrics <- combine_hp_performance(models)
plot_hp_performance(hp_metrics$dat, lambda, AUC)
} # }